Updated by Sales POP in November 2026.
A CRM dashboard shows your pipeline, forecast and sales activity on one live screen, pulled straight from the CRM, so nobody has to rebuild a spreadsheet to see where deals stand. Sales teams are moving off spreadsheets because a spreadsheet is a copy. It is out of date as soon as someone exports it, every manager ends up with a different version, and reps lose selling time keeping it current. A dashboard updates when the CRM does, and each role sees the numbers it needs.
Sales POP is published by Coevera (formerly Pipeliner CRM), which is one of the CRMs discussed in this article.
Picture this: It’s Monday morning, and instead of drowning in spreadsheet tabs and waiting for last week’s sales report, your team opens one screen that shows everything. Three deals have been sitting in limbo for too long. Your pipeline is trending south. Two big prospects haven’t replied in nearly a week.
No data exports. No report requests. Just answers, right now.
What is a CRM dashboard?
A CRM dashboard is your sales data, visualized and updated automatically as your team works. Unlike a static report sitting in someone’s inbox from last Friday, a dashboard gives you a living view of your pipeline.
Think of it as the difference between checking yesterday’s weather forecast and looking out your window. One tells you what was supposed to happen. The other shows you what’s actually happening right now.
How is a dashboard different from a report?
Dashboards are like the scoreboard at a game. They update live while the action unfolds. You glance up and immediately know the score, who’s winning, and how much time remains.
Reports are the post-game analysis. They dive deep into what happened, why it happened, and what patterns emerged. Essential for strategy sessions, but not helpful when you need to make a decision in the next ten minutes.
Sales teams need both, but they serve different purposes. You check your dashboard to see if today’s going according to plan. You pull a report to figure out why last quarter missed the mark.
Can you use Excel as a CRM dashboard?
You can, and many teams start there. A spreadsheet works while one person owns it and the numbers change slowly. It breaks down once several reps update deals every day. Someone has to export, paste and refresh the data, copies drift apart, and nobody is sure which version is current. A spreadsheet also has no link to the emails, meetings and notes behind each deal, so the numbers lose their context. If someone on your team rebuilds the same pipeline sheet every week, that is the sign to move the view into the CRM.
Why does a live dashboard matter for your sales team?
Seeing your entire pipeline at once
Remember when understanding your pipeline meant opening dozens of individual deal records? Or worse, waiting until the Friday team meeting to find out something went sideways on Tuesday?
Real-time pipeline visibility changes that. You get a bird’s-eye view of every opportunity, updated automatically, showing what’s moving forward and what’s stuck.
Instead of discovering problems during weekly reviews, reps spot them as they emerge. Has that deal been sitting in negotiation for three weeks? It gets attention before it becomes a lost cause. When a high-value prospect goes quiet, the dashboard shows it. When a territory starts underperforming, managers can step in while there’s still time to turn things around.
Catching deals before they stall
A useful dashboard also flags at-risk opportunities, such as deals with missed meetings, a stage that has run long or no recent follow-up, so the right people know when a deal needs attention.
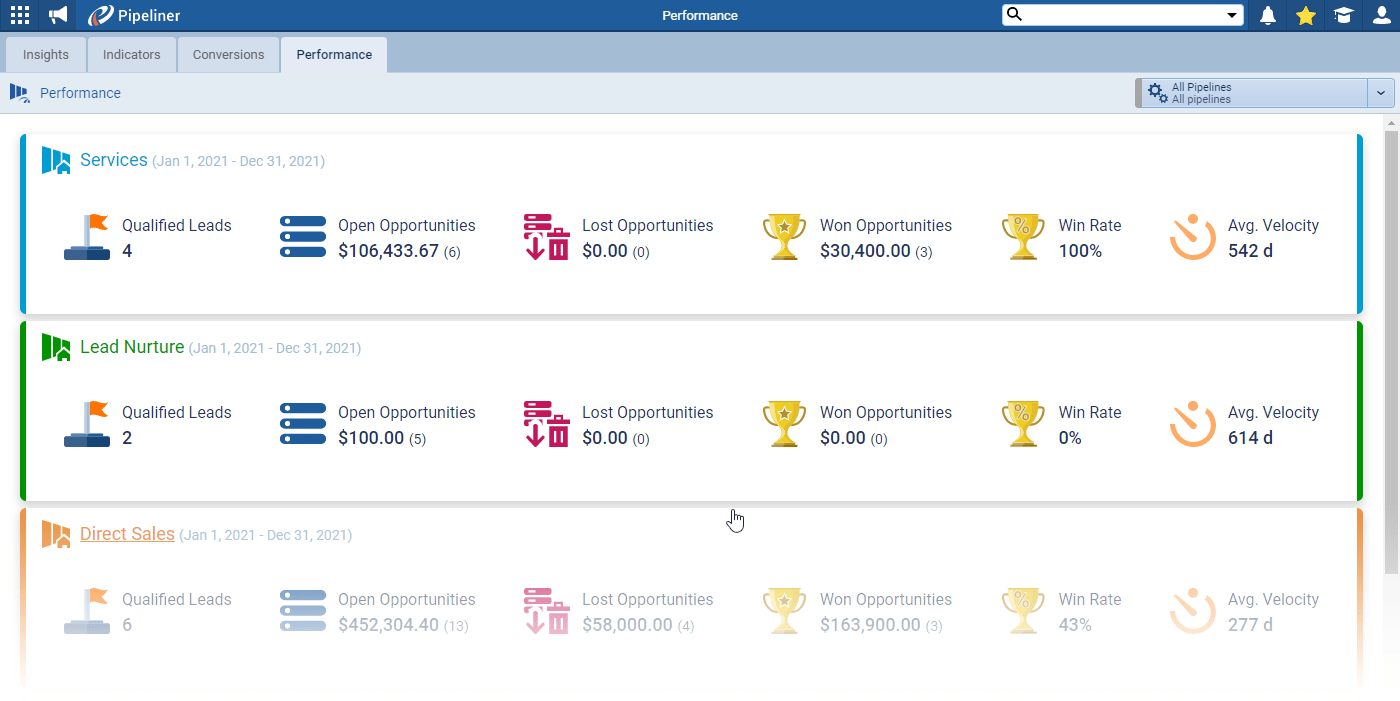
Tracking deal velocity, win rates and pipeline health also shows patterns. If several deals keep getting stuck during contract negotiations, that points to a process problem, not a single bad deal.
More accurate revenue forecasting
A forecast built on live deal data and past patterns is easier to trust than one built on gut feel. If deals from a specific industry typically close faster, the forecast can reflect that for similar prospects. Revenue projections then follow actual sales behavior instead of optimistic guesses. The catch: a forecast is only as good as the data reps enter, which is why adoption matters as much as the dashboard itself.
Getting time back to actually sell
The average seller spends only 40% of their time selling, according to Salesforce’s 2026 State of Sales report. The report names administrative bottlenecks, not effort or skill, as the real drag on seller productivity.
A dashboard inside the CRM removes part of that work. Instead of exporting reports, updating spreadsheets, and hunting across platforms, reps see everything they need in a single location. If reps still keep their own spreadsheets on the side, see how to get reps to actually use the CRM.
Which metrics belong on a sales dashboard?
Revenue and performance
Your dashboard should always show monthly and quarterly revenue against targets. This comparison reveals whether you’re on track or need to accelerate activity. Without this baseline, other metrics lack meaning.
Average deal size shows whether pricing pressure or successful upselling is moving revenue. A declining average can signal competitive pressure or discounting. A rising average points to stronger value positioning or a move upmarket.
Win rate measures the share of qualified opportunities you close. It shows whether pipeline quality matches quantity. Revenue per rep, compared across territories, identifies top performers and highlights coaching opportunities.
Pipeline health
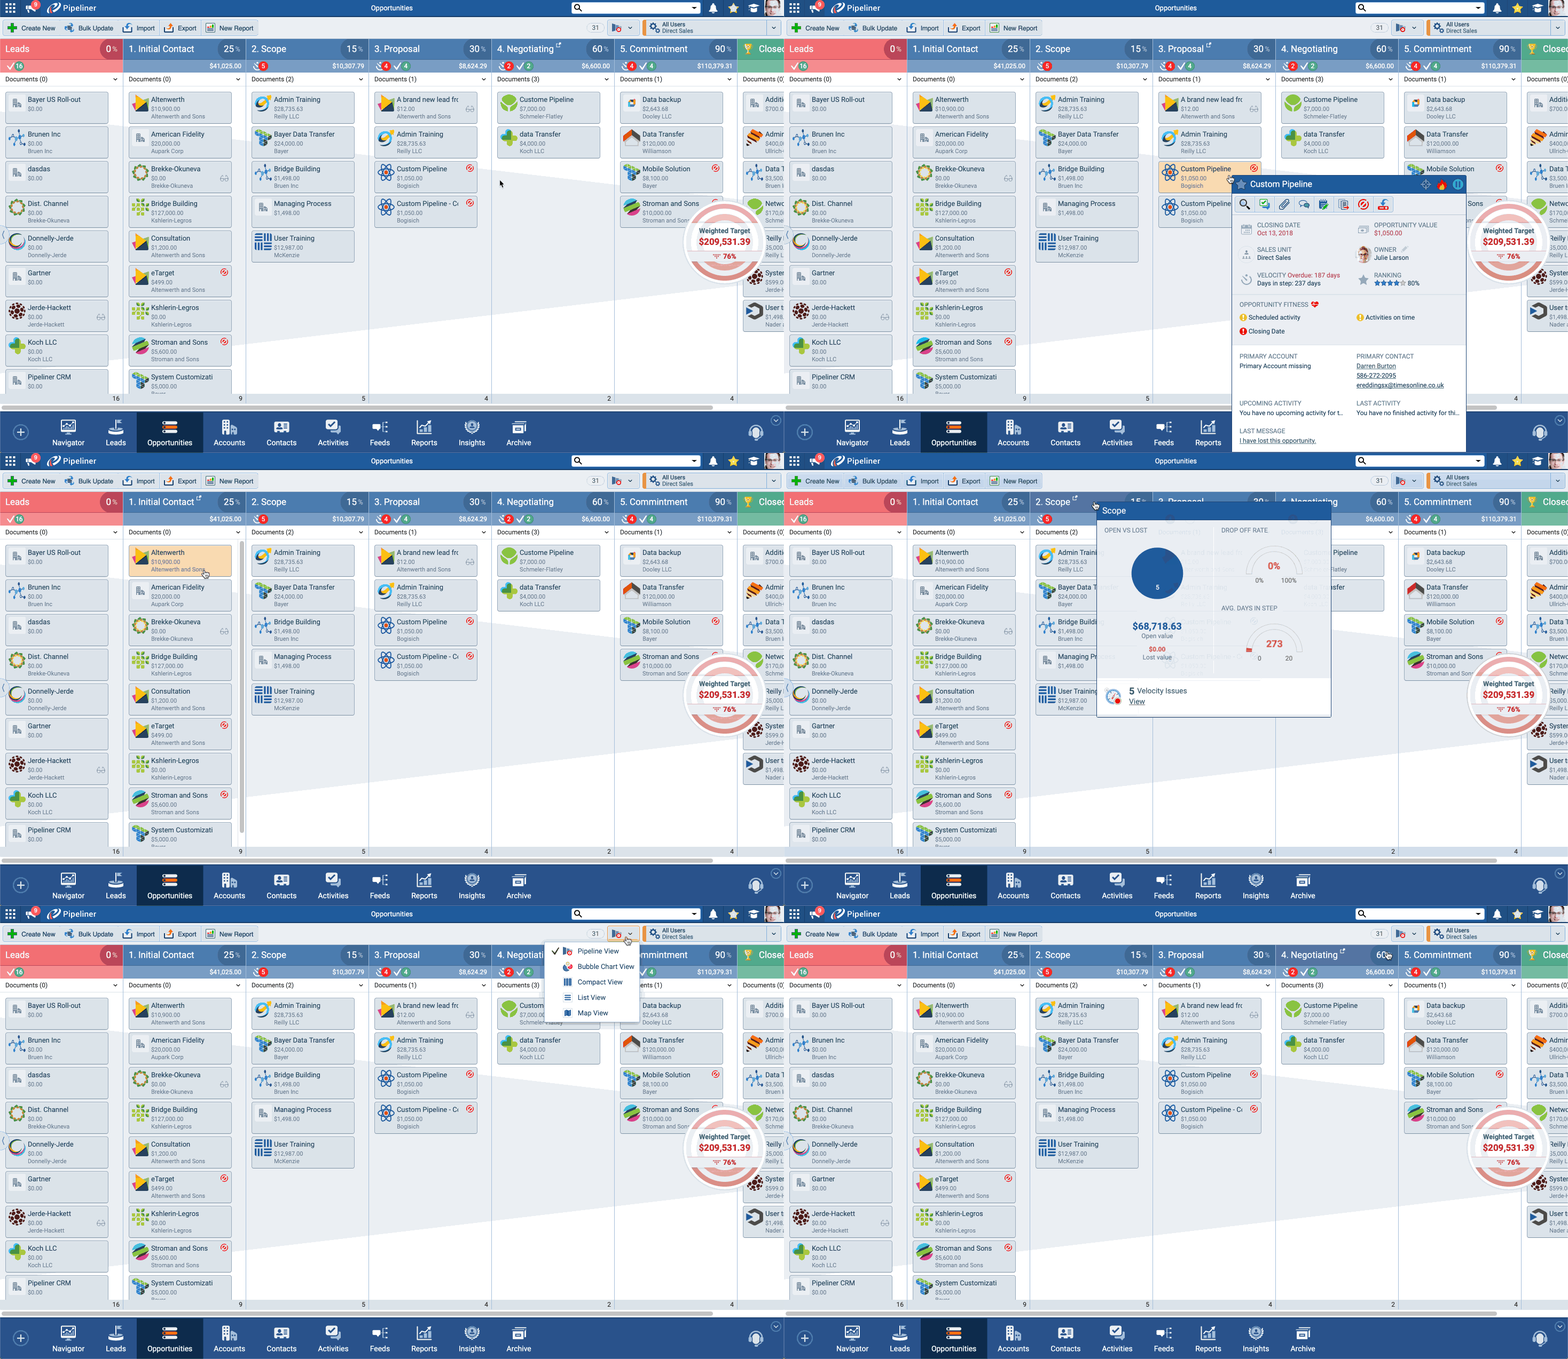
Average sales cycle length by stage shows where deals typically speed up or stall. If opportunities consistently spend three weeks in contract review, you know exactly where to focus process improvements.
Conversion rates between pipeline stages reveal bottlenecks. For example, a team that converts 60% from discovery to proposal but only 20% from proposal to close has a problem with proposal quality or pricing.
Deal velocity shows pipeline momentum. Slowing velocity signals a future revenue shortfall before it shows up in quarterly results. Pipeline value by stage and territory helps managers allocate resources and set realistic forecasts.
Activity and engagement
Quota attainment by rep shows individual performance against targets. It identifies who needs coaching and who deserves recognition. It also surfaces territory or product issues when several reps in the same segment underperform.
Notable open and closed deals keep everyone focused on the biggest opportunities and recent wins. Year-to-date performance gives long-term context beyond monthly swings.
How many metrics should one dashboard show?
As a rule of thumb, keep each dashboard to five to seven key metrics. More widgets create clutter instead of clarity.
Define every metric precisely. “Customer satisfaction” means nothing on a dashboard until you decide how you measure it, what the target is, and when you review it. If nobody changes what they do because of a metric, take it off the dashboard.
What should each role see on a CRM dashboard?
Most CRMs let you build a different dashboard for each role, so every person sees relevant numbers without clutter. A sales rep doesn’t need company-wide forecasts that distract from personal numbers. An executive doesn’t need granular activity logs. When everyone sees exactly what they need to do their job, adoption goes up.
Sales reps
Personal pipeline and quota progress should be front and center. Reps need to see how close they are to monthly targets and which deals will get them there.
Upcoming tasks and deals that need attention keep reps on the highest-priority work. A dashboard that surfaces the three most urgent opportunities stops important follow-ups from slipping through the cracks.
Sales managers
A pipeline snapshot across the whole team shows which reps need support and which territories are trending below forecast.
Average sales cycles and deal amounts reveal team-wide patterns that individual reps might miss. Conversion rates by rep and territory point to coaching opportunities, early enough to save the quarter.
Executives
Year-to-date performance against targets, overall sales performance against forecast, and top reps by quota attainment give executives the strategic view without operational detail. They need to spot trends and make resource decisions, not manage individual deals.
Can you build a CRM dashboard without code?
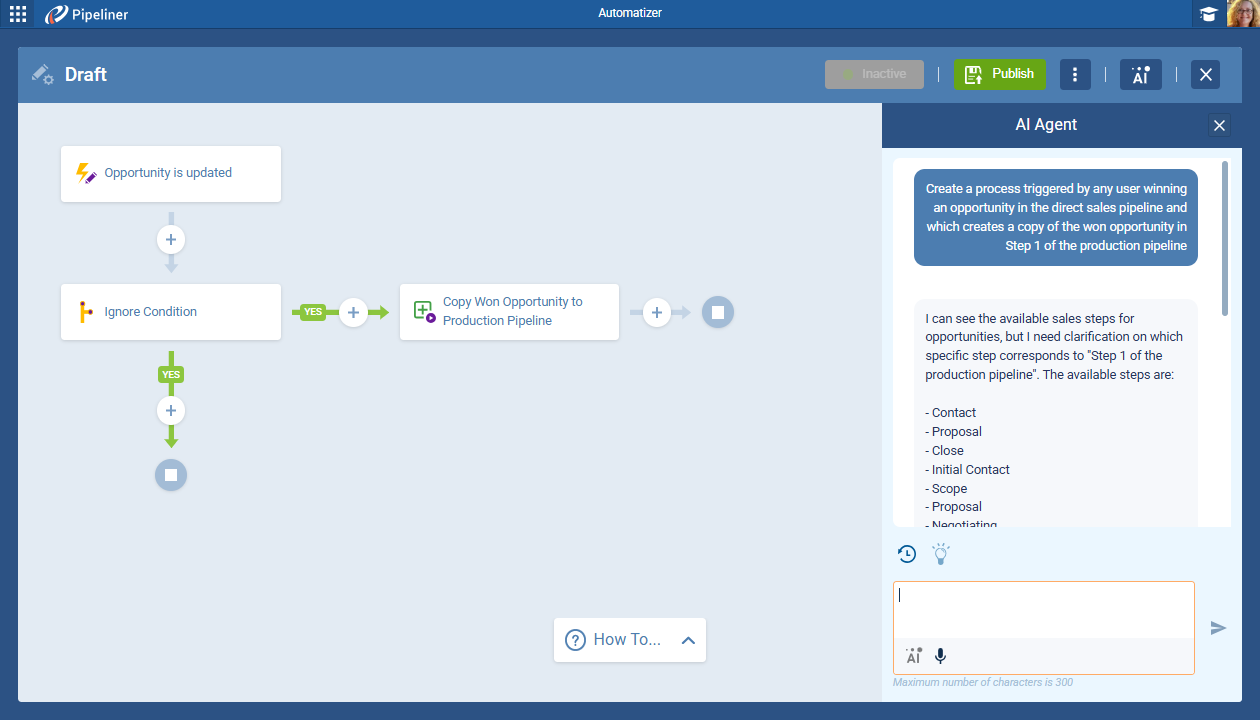
In most modern CRMs, yes. Drag-and-drop builders let users select widgets, arrange layouts and choose metrics through visual interfaces. No SQL queries, no custom code, no IT ticket.
That matters because a dashboard should change as the team’s process changes. When sales teams can adjust their own views, they keep the ones that help them sell and drop the ones that don’t.
How long does setup take?
A pre-built template for a standard view, such as pipeline tracking, quota progress or an activity summary, can be running the same day. A fully custom set of dashboards takes longer, often weeks, because you have to define the metrics, map the data sources, design the layouts and test them with real users. Predictive features, such as AI forecasts, need time on top of that: they improve as the CRM collects more of your own deal history.
Setup time for the dashboard is only part of the story. For the implementation questions to ask vendors before you buy, see how to evaluate a sales CRM.
How do you get dashboard implementation right?
Start with clear objectives
Begin with the business objective the dashboard should serve. Are you trying to improve forecast accuracy? Shorten the sales cycle? Increase average deal size? The objective decides which metrics matter. If the goal is a shorter sales cycle, track time in each stage, conversion rates and deal velocity, and leave revenue metrics for a different dashboard.
Design for specific users
Build dashboards for specific teams and roles rather than forcing everyone into the same view. Sales teams focus on leads, conversions and the funnel. Marketing teams focus on campaign performance and lead quality. Customer success teams track retention and expansion. Same CRM, different dashboards.
Avoid information overload
Track only the metrics people will act on. Too many widgets bury the critical signals. Fewer, higher-impact measures work better because they focus attention on what matters most.
Set the right refresh rate
Stale data defeats the purpose of a dashboard. As a rule of thumb, critical pipeline metrics should update in real time or every 15 to 30 minutes. Activity metrics need faster updates than monthly summaries. Daily call volume should be live, while year-to-date revenue can refresh hourly without losing value.
How do the main CRMs handle dashboards?
Every major CRM includes dashboards. The differences are in how much you can customize without help, and whether deeper analytics cost extra. Check each vendor’s pricing page for current tiers.
| CRM | How dashboards work | Best fit |
|---|---|---|
| Salesforce | Reports and dashboards come with Sales Cloud. Revenue Intelligence, powered by CRM Analytics, adds out-of-the-box dashboards and analytics across the sales cycle. | Large sales organizations with complex processes and admin support |
| HubSpot | Dashboards show marketing, sales, revenue and service data in one place. Custom reports start on the Professional tier. | Teams that run marketing and sales in HubSpot |
| Pipedrive | Insights dashboards turn deal, revenue and activity data into charts and tables, and live dashboards can be shared with stakeholders. | Teams that want simple pipeline reporting |
| Coevera | Custom dashboards with a drag-and-drop layout that update as soon as the team updates the CRM. Each user sees only the data they have permission to view. The BI Feeder add-on exports data to outside BI tools such as Tableau and Microsoft Power BI, synced every 24 hours. | B2B sales organizations with a defined sales process and sales managers accountable for pipeline |
| Zoho CRM | Advanced CRM Analytics, powered by Zoho Analytics, adds deeper reports and dashboards and needs a Zoho Analytics Basic plan or above. | Teams already using other Zoho apps |
| Microsoft Dynamics 365 Sales | Dashboards bring views, lists and charts into one place, and Power BI tiles and dashboards can be added to personal dashboards once an admin turns on Power BI embedding. | Organizations that already run on Microsoft 365 |
For a fuller comparison of pricing models, setup and fit across five of these CRMs, see our mid-market CRM comparison.
What do mid-market B2B teams need from CRM dashboards?
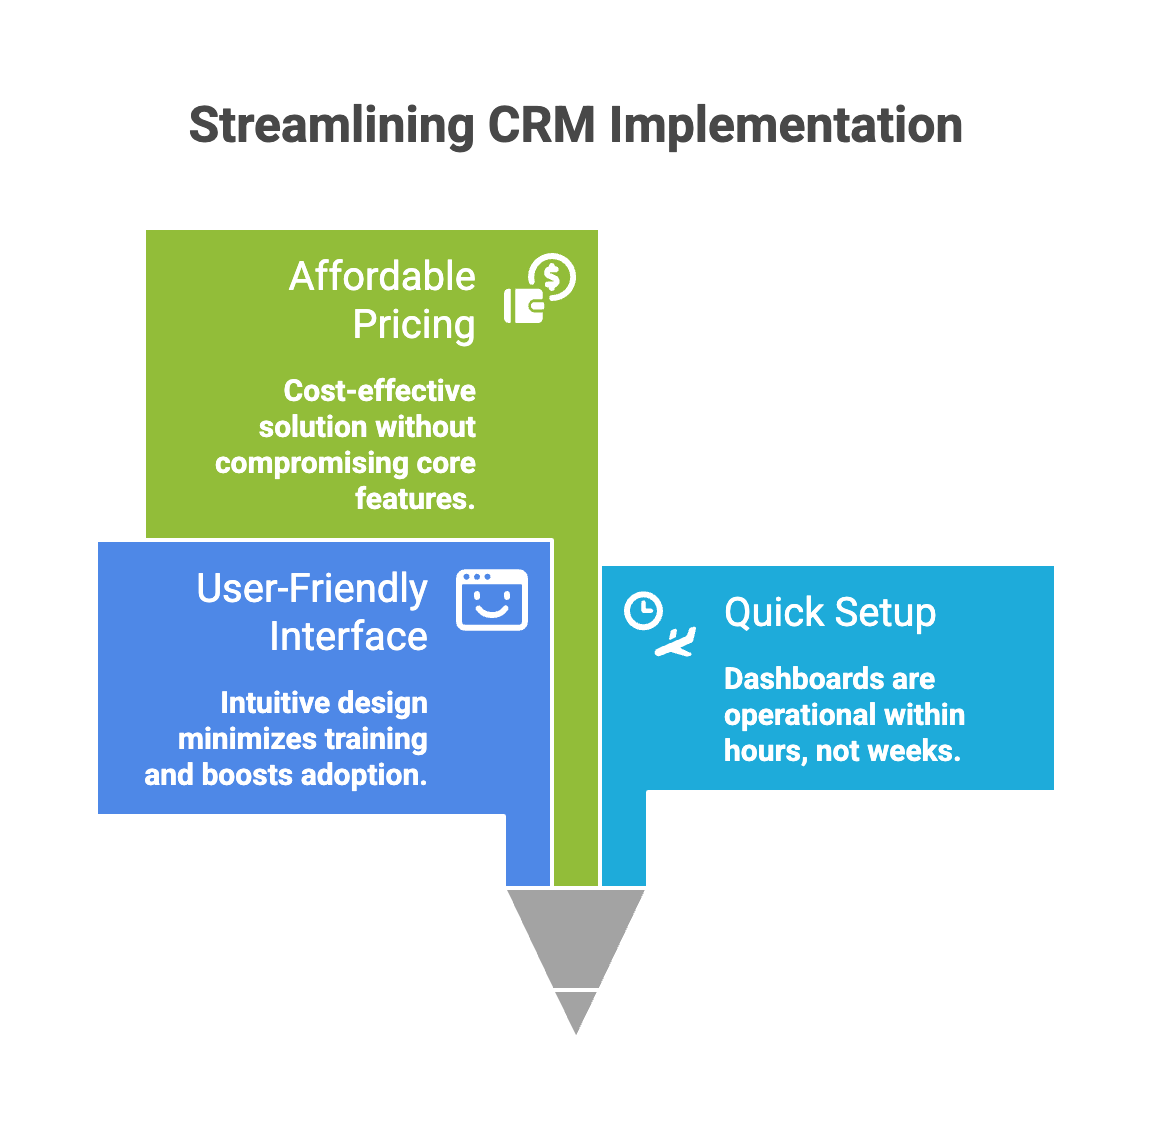
Mid-market sales organizations need a system strong enough for a multi-stage, multi-stakeholder sales process, yet simple enough that reps adopt it without a dedicated IT team. Most platforms lean toward one side: easy but shallow, or powerful but heavy.
With several territories, products and sales stages, basic reporting stops being enough. The sweet spot is real pipeline analytics in an interface the team can customize itself as its process evolves, without consultants.
Three features matter most:
- Dashboards for every role. Reps, managers and executives each get their own view, without cluttering anyone’s screen with irrelevant numbers.
- Integrations that remove double entry. When the CRM connects to email, calendar, marketing automation and customer success tools, the dashboard reflects the full picture of each customer.
- Lead and deal prioritization. The dashboard should surface which leads and deals are most likely to convert, based on engagement, fit and past patterns.
Built-in dashboards or a separate BI tool?
For day-to-day selling, built-in dashboards usually win. Sellers already work in the CRM, so a dashboard on the same platform gives them the full view, and the detail behind it, without extra effort.
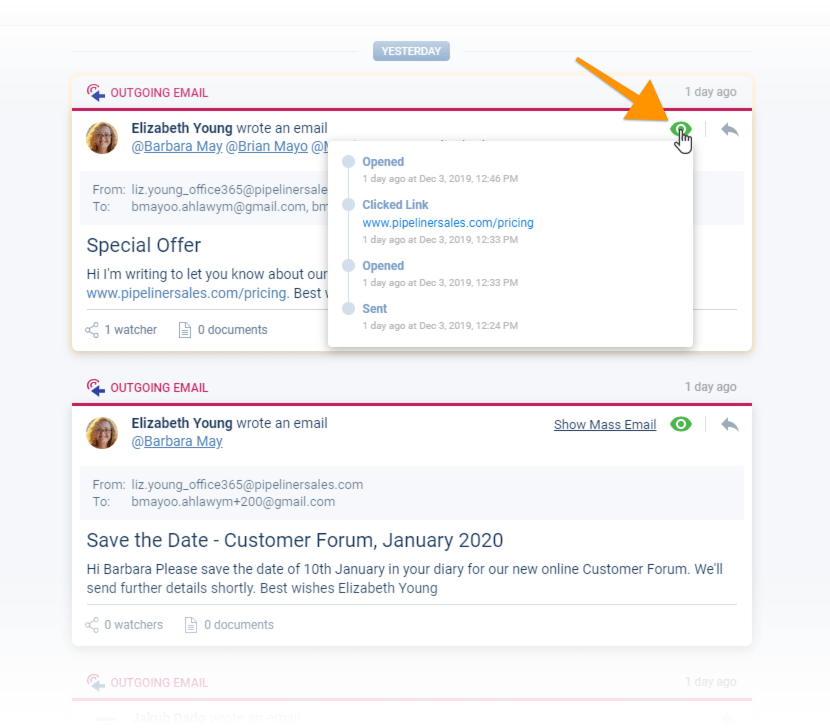
Exporting data to a separate tool is slow and error-prone. An export has a limited scope and goes stale immediately, while your pipeline keeps moving. A separate BI tool still earns its place for deeper analysis that combines CRM data with finance or product data. In that case, connect it to the CRM so the data flows automatically instead of being copied by hand.
Is a CRM dashboard worth it?
For most sales teams, yes. A spreadsheet tells you where the pipeline stood when someone last updated it. A CRM dashboard tells you where it stands now, and gives each role the few numbers it needs to act.
When choosing a platform, prioritize dashboards built into the CRM, customization your team can do itself, and clean integrations, over adding a separate reporting layer that has to be kept in sync. Since sellers already update their deals in the CRM, putting the analytics there removes the friction that kills adoption and leaves insights buried in unused spreadsheets.