

Picture this: It’s Monday morning, and instead of drowning in spreadsheet tabs and waiting for last week’s sales report, your team opens one screen that shows everything. Three deals have been sitting in limbo for too long. Your pipeline is trending south. Two big prospects haven’t replied in nearly a week.
No data exports. No report requests. Just answers, right now.
That’s the shift happening across sales floors everywhere. Teams are trading their patchwork of tools and reports for CRM systems with analytics baked right in. And the results? They’re hard to ignore.
Consider this: sales reps currently waste nearly three-quarters of their workweek on tasks that aren’t actually selling. They’re toggling between apps, hunting down information, and updating systems. Meanwhile, companies using real-time CRM dashboards are seeing sales jump by nearly 30% on average.
The CRM analytics market tells the same story—it hit $73.4 billion last year and continues to grow at double-digit rates. When your team can actually see what’s happening in the pipeline without piecing together five different reports, deals move faster.
What Exactly Is a CRM Analytics Dashboard?
Let’s get practical. A CRM analytics dashboard is your sales data, visualized and updated automatically as your team works. Unlike those static reports sitting in someone’s inbox from last Friday, dashboards give you a living view of your pipeline.
Think of it as the difference between checking yesterday’s weather forecast and looking out your window. One tells you what was supposed to happen. The other shows you what’s actually happening right now.
The Dashboard vs. Report Distinction
Here’s the easiest way to understand the difference:
Dashboards are like the scoreboard at a game—they update live while the action unfolds. You glance up and immediately know the score, who’s winning, and how much time remains.
Reports are the post-game analysis. They dive deep into what happened, why it happened, and what patterns emerged. Essential for strategy sessions, but not helpful when you need to make a decision in the next ten minutes.
Sales teams need both, but they serve completely different purposes. You check your dashboard to see if today’s going according to plan. You pull a report to figure out why last quarter missed the mark.
Why This Matters for Your Sales Team
Seeing Your Entire Pipeline at Once
Remember when understanding your pipeline meant opening dozens of individual deal records? Or worse, waiting until the Friday team meeting to find out something went sideways on Tuesday?
Real-time pipeline visibility changes that equation entirely. You get that bird’s-eye view of every opportunity, updated automatically, showing what’s moving forward and what’s stuck.
The impact on how teams operate is substantial. Instead of discovering problems during weekly reviews, reps spot them as they emerge. Has that deal been sitting in negotiation for three weeks? It triggers attention before it becomes a lost cause.
This immediate visibility also means faster responses to customer needs. When a high-value prospect goes radio silent, your dashboard flags it immediately. When a territory starts underperforming, managers can step in while there’s still time to turn things around.
Catching Deals Before They Die
Modern CRMs use AI to identify at-risk opportunities based on patterns such as missed engagements, long sales cycles, and lack of follow-up. These systems notify the right people when deals need immediate attention.
Automatic tracking of deal velocity, win rates, and pipeline health provides alerts when opportunities stagnate. If several deals consistently get stuck during contract negotiations, that pattern indicates a systemic issue that requires process adjustments or additional resources.
One private equity firm struggled with forecasts that were regularly missed by 25-30%. After implementing enrichment tools that automatically tracked meeting frequency and engagement signals, they improved forecast accuracy by 18% in just three months. The difference? Visibility into which deals had real momentum versus those just occupying pipeline space.
More Accurate Revenue Forecasting
Predictive forecasting typically improves accuracy by 20-30% compared to traditional gut-feel methods. While intuition-based forecasting often misses targets by 10% or more, data-driven models can achieve 75-95% accuracy with clean data and consistent usage.
The stakes are significant. Poor data quality costs companies 15-25% of their annual revenue, with inaccurate forecasting being a major culprit. Yet 55% of sales leaders admit they lack confidence in their forecasts, and 67% of organizations don’t even have a formal forecasting process.
CRM dashboards address this by pulling real-time deal data and historical patterns to generate more accurate revenue projections. If deals from a specific industry typically close faster, the forecast automatically adjusts expectations for similar prospects. Revenue projections reflect actual sales behavior instead of optimistic guesses.
Getting Time Back to Actually Sell
Sales reps spend 40% of their time on administrative work instead of selling. That’s two full days every week lost to non-revenue activities. The problem intensifies when teams juggle an average of 10 different tools per day, with 66% of reps reporting they’re overwhelmed by the sheer number.
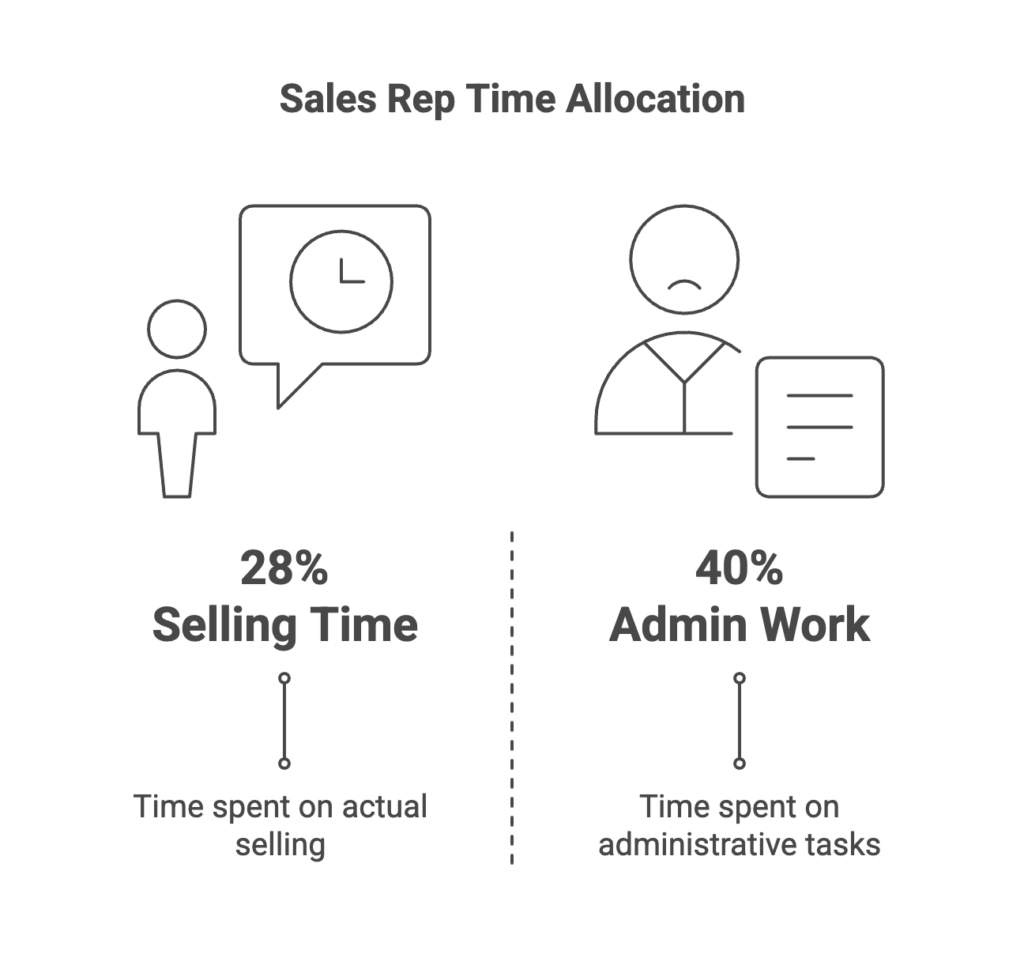
Tool fragmentation creates more than just screen-switching frustration. Research from UC Irvine found it takes an average of 23 minutes to fully refocus on a task after an interruption. Multiply that by dozens of daily tool switches, and you understand why only 28% of a sales rep’s time goes to actual selling.
Unified CRM dashboards eliminate this waste. Pipedrive users cut administrative hours by 40% by consolidating data into one view. Instead of exporting reports, updating spreadsheets, and hunting across platforms, reps see everything they need in a single location.
The Metrics That Actually Matter
Revenue and Performance Tracking
Your dashboard should always show monthly and quarterly revenue against targets. This comparison reveals whether you’re on track or need to accelerate activity. Without this baseline, other metrics lack meaning.
Average deal size reveals whether pricing pressure or successful upselling is driving it. A declining average signals competitive threats or discounting problems. An increasing average indicates effective value positioning or movement upmarket.
Win rate measures the percentage of qualified opportunities you close successfully. This metric exposes whether pipeline quality matches quantity. Revenue per rep normalized across territories identifies top performers and highlights coaching opportunities for struggling team members.
Pipeline Health Indicators
Average sales cycle length by stage shows where deals typically accelerate or stall. If opportunities consistently spend three weeks in contract review, you know exactly where to focus process improvements or add resources.
Conversion rates between pipeline stages reveal bottlenecks in your sales process. A 60% conversion from discovery to proposal, but only 20% from proposal to close signals problems with proposal quality or pricing strategy.
Deal velocity and progression trends indicate pipeline momentum. Slowing velocity signals future revenue shortfalls before they affect quarterly results. Pipeline value by stage and territory helps managers allocate resources and set realistic forecasts.
Activity and Engagement Tracking
Sales rep quota attainment shows individual performance against targets. This metric identifies who needs coaching and who deserves recognition. It also surfaces territory or product issues when multiple reps in the same segment underperform.
Notable open and closed deals keep everyone focused on the biggest opportunities and recent wins. Celebrating closed deals builds momentum. Highlighting major open opportunities ensures they receive appropriate attention.
Year-to-date performance provides long-term context beyond monthly fluctuations. Individual and team comparisons create healthy competition and identify best practices worth replicating across the organization.
How Many Metrics Should You Track?
Display a maximum of five to seven key metrics. The human mind struggles to process more than seven pieces of information simultaneously. More widgets create clutter instead of clarity.
Every KPI must be specific, measurable, achievable, relevant, and timely. Vague metrics like “customer satisfaction” need to be defined. How do you measure it? What’s the target? When do you review it?
Select the most impactful metrics to concentrate team efforts rather than tracking everything possible. Real-time tracking, displayed via customizable dashboards, makes data easier to understand, empowering teams to spot trends and adjust their approach.
Customizing Dashboards by Role
Why Different Roles Need Different Views
Most CRM platforms enable role-based dashboard customization, ensuring each team member sees relevant metrics without clutter. A sales rep doesn’t need company-wide forecasts that might distract from personal numbers. An executive doesn’t need granular activity logs.
Different dashboards for sales reps, managers, and executives match information to each role’s decision-making authority. Reps focus on their pipeline and daily activities. Managers monitor team performance and resource allocation. Executives track strategic metrics and overall business health.
Role-specific views enhance productivity by reducing time spent hunting for critical information. When everyone sees exactly what they need to do their job, adoption increases, and data-driven decision-making becomes part of the culture.
What Sales Reps Need to See
Personal pipeline and quota progress should be front and center, giving reps immediate visibility into performance. They need to see how close they are to monthly targets and which deals will get them there.
Upcoming tasks and deals requiring attention keep reps focused on the highest-priority activities. A dashboard that surfaces the three most urgent opportunities prevents important follow-ups from slipping through cracks.
Individual performance tracking without company-wide forecasts maintains focus on controllable actions. Quick visibility into which opportunities are approaching closure helps reps prioritize time effectively.
What Sales Managers Need to See
A pipeline snapshot across all team members gives managers the aerial view needed for resource allocation. They can see which reps need support and which territories are trending below forecast.
Average sales cycles and deal amounts reveal team-wide patterns that individual reps might miss. If the entire team’s average deal size is declining, that’s a strategic issue requiring management intervention.
Conversion rates by rep and territory identify coaching opportunities and best practices. Declining win rates and underperforming territory identification enable timely interventions while there’s still time to salvage the quarter.
What Executives Need to See
Year-to-date performance against target KPIs provides executives with the strategic view they need without operational details. They want to know if the business is on track, not which individual deals are in negotiation.
Overall sales performance versus forecast shows whether revenue projections remain achievable. Top sales reps by quota attainment highlight talent worth retaining and promoting.
An aerial view, devoid of granular operational details, keeps executives focused on strategic decisions. They need to spot trends and make resource allocation decisions, not manage individual deals.
Building Dashboards Without Code
Drag-and-Drop Simplicity
No-code platforms eliminate the need for coding in dashboards, making customization accessible to anyone regardless of technical background. Sales teams can create and modify their views without submitting IT tickets or waiting weeks for development resources.
Drag-and-drop builders let users select widgets, arrange layouts, and configure KPIs through visual interfaces. You click, drag, and drop components into place. No SQL queries. No custom code. No technical debt.
Sales teams create and customize dashboards independently, iterating based on what actually helps them sell. Visual tools eliminate dependency on IT teams, accelerating implementation and ensuring dashboards evolve with changing business needs.
How Long Does Setup Take?
Basic templates take hours to set up when using pre-built configurations. You select a template, adjust a few settings, and start using it the same day.
Complex custom implementations can take weeks to build from scratch with extensive customization. These projects involve defining KPIs, mapping data sources, designing layouts, and testing with actual users.
No-code platforms reduce setup to minutes for standard dashboard types. Pre-built templates accelerate standard views like pipeline tracking, quota monitoring, and activity summaries that most sales teams need.
Platform-Specific Features
Monday CRM offers drag-and-drop components with simple configuration, making it accessible to users of any technical skill level. The platform provides visual, no-code tools that anyone can master quickly.
Customizable from the smallest details without technical skills, monday CRM lets teams adjust colors, layouts, widgets, and data sources through intuitive interfaces. This flexibility means dashboards can match specific workflows without compromise.
Suitable for small businesses through enterprise scale, the platform grows with your organization. A five-person startup and a 500-person sales team both benefit from the same no-code customization capabilities.
Getting Dashboard Implementation Right
Start with Clear Objectives
Begin by identifying the business objectives your dashboard should address. Are you trying to improve forecast accuracy? Reduce sales cycle length? Increase average deal size? The objective determines which metrics matter.
Align relevant KPIs to specific objectives rather than displaying every available metric. If your goal is to reduce sales cycle length, track time in each stage, conversion rates, and deal velocity. Leave revenue metrics for a different dashboard.
Data visualization illuminates the path to goals when designed with purpose. Each widget should answer a specific question or highlight a particular risk. Random metrics create noise instead of insight.
Design for Specific Users
Create dashboards for specific teams, roles, and hierarchies rather than forcing everyone to use the same view. What helps a sales rep close deals differs from what helps a manager allocate resources.
Executive dashboards provide an aerial view of strategic performance without operational details. Analyst dashboards delve into granular details that would overwhelm executives but are necessary for identifying process improvements.
Sales teams emphasize leads, conversions, and sales funnels. Marketing teams focus on campaign performance and lead quality. Customer success teams track retention and expansion opportunities. Same CRM, different dashboards.
Avoid Information Overload
Track only KPIs that truly matter instead of displaying every available metric. Too many widgets overwhelm teams rather than help, burying critical signals in the noise.
Tailor dashboards so teams see relevant data without scrolling through information that doesn’t apply to their role. Fewer, higher-impact measures outperform broad metric collections because they focus attention on the highest priorities.
Excessive metrics bury signals among noise and make dashboards unproductive. Display only metrics that will get acted upon. If no one changes their behavior in response to a metric, remove it from the dashboard.
Set the Right Refresh Rate
Critical metrics should refresh in real time or every 15-30 minutes to provide up-to-date visibility into pipeline status and deal health. Stale data defeats the purpose of a dashboard.
Refresh frequency depends on data volume and system capabilities. High-volume transactional systems might update every few minutes. Lower-volume B2B pipelines might refresh every 30 minutes without issue.
Activity metrics update more frequently than monthly summaries. Daily call volume needs real-time updates. Year-to-date revenue can refresh hourly without losing value.
Comparing Popular CRM Platforms
Salesforce: The Enterprise Powerhouse
Salesforce offers Revenue Intelligence, powered by CRM Analytics, which equips sales teams with purpose-built analytics across the entire sales cycle. The platform provides out-of-the-box intelligence and analytics that enable accurate forecasting and pipeline management.
The reporting features offer extensive customization with in-depth capabilities. You can go as deep as needed, but powerful reporting doesn’t require CRM expertise. The tool understands what information your team needs to succeed.
Best for: Enterprise sales organizations that require extensive customization and are willing to invest in implementation.
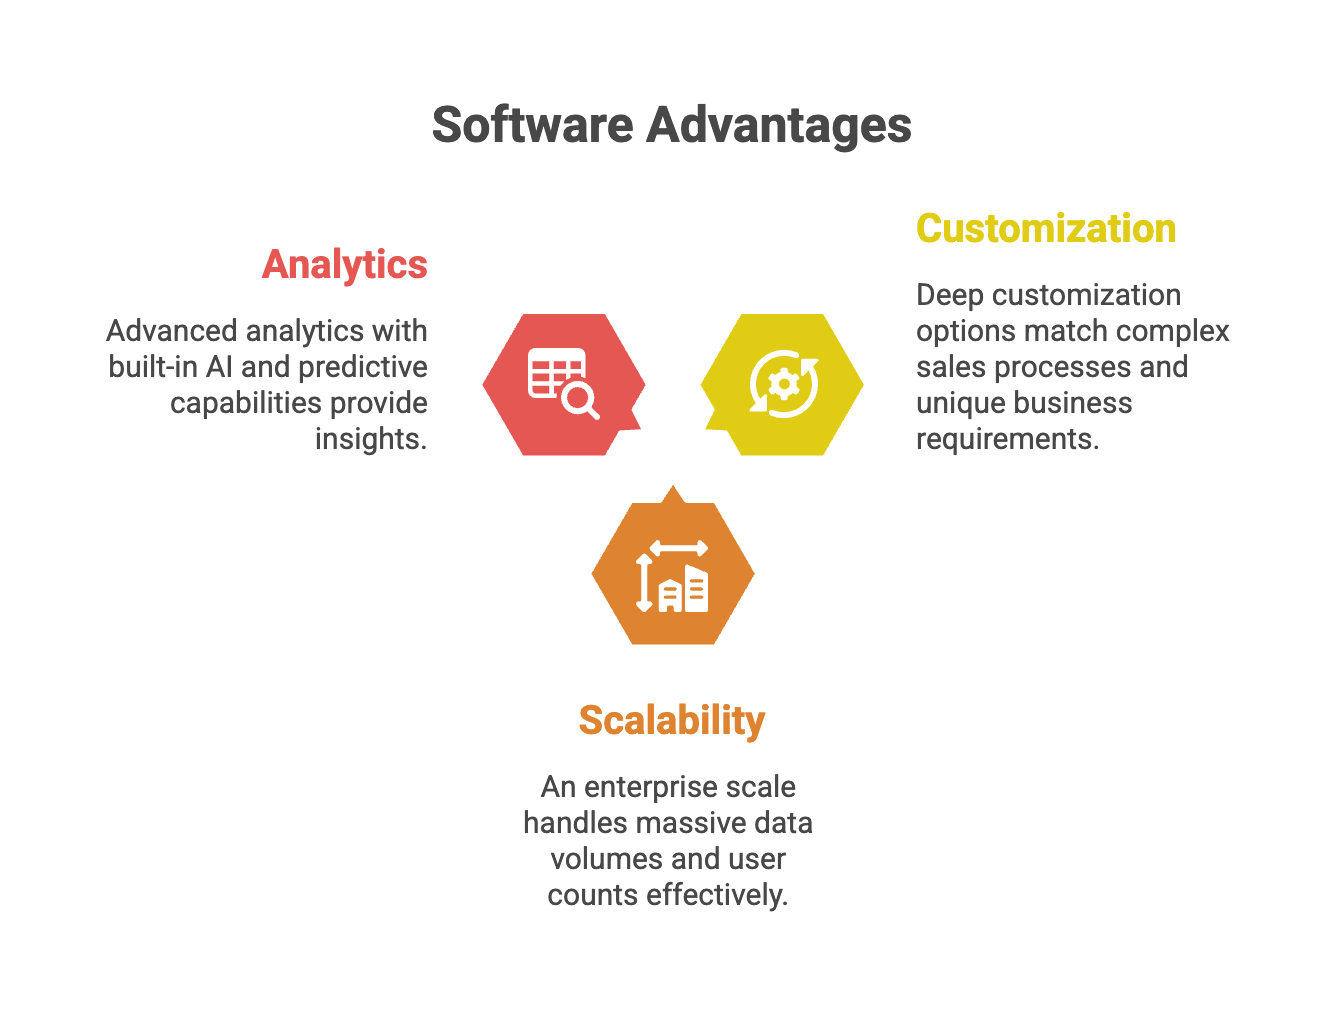
Advantages:
- Deep customization options that match complex sales processes and unique business requirements
- An enterprise scale that handles massive data volumes and user counts
- Advanced analytics with built-in AI and predictive capabilities
Limitations:
- Steep learning curve requiring significant training investment and often dedicated administrators
- High cost that reaches enterprise levels quickly, especially with advanced analytics features
- Overwhelming options that can paralyze teams needing straightforward pipeline visibility
HubSpot: The Balanced Choice
HubSpot’s custom report builder strikes a balance, hitting a sweet spot between the complexity of Salesforce and the limitations of simpler platforms. The platform allows tailored reports without requiring steep learning curves.
Unified dashboards combine sales and marketing data into a single place, providing a comprehensive, real-time view of business performance. Automated data capture eliminates redundant manual work, saving hours each week.
Best for: Mid-market B2B teams wanting unified sales and marketing visibility.
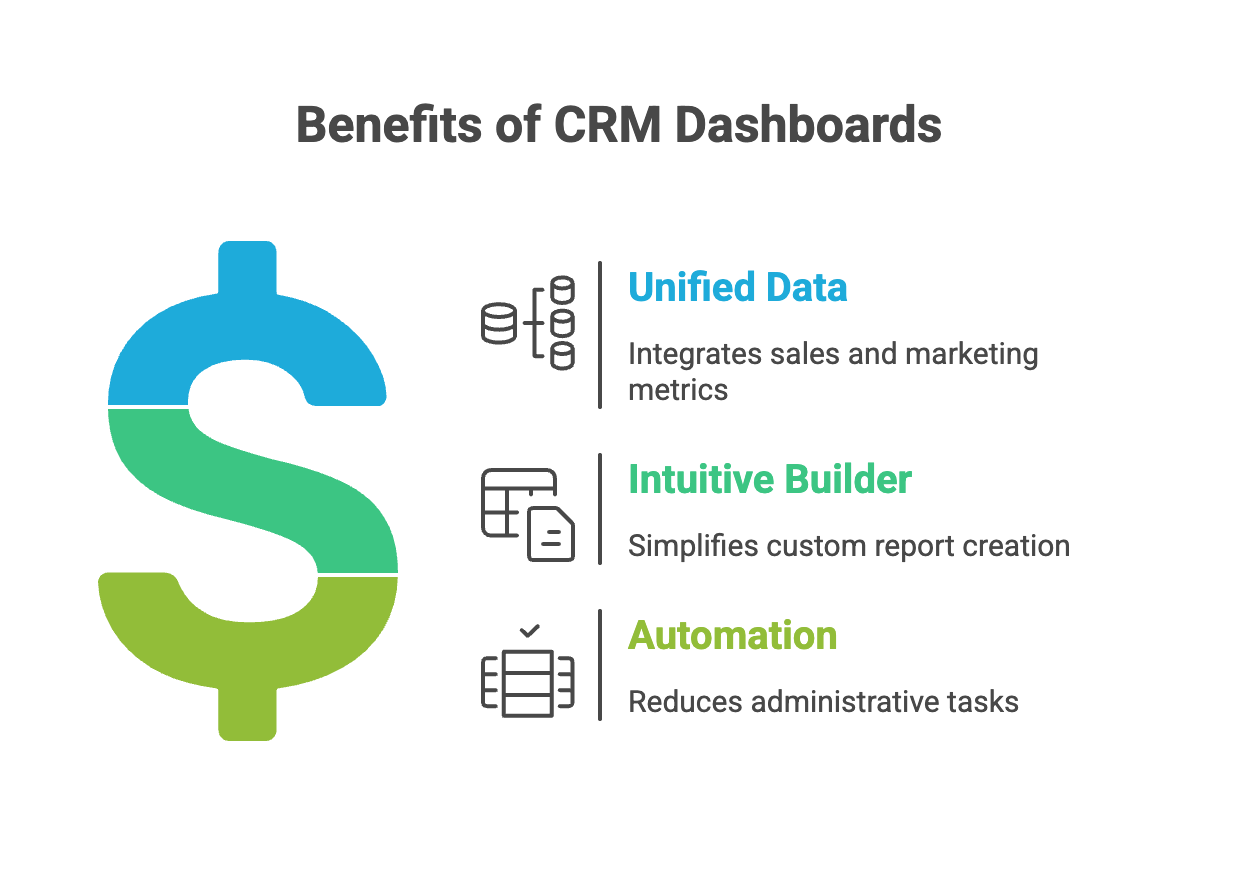
Advantages:
- Unified data brings sales and marketing metrics together in one dashboard
- Intuitive builder for custom reports without Salesforce complexity
- Strong automation that reduces the administrative burden significantly
Limitations:
- Marketing bias, as the platform originated as marketing automation
- Pricing tiers where advanced reporting requires higher-tier subscriptions
- Limited customization compared to Salesforce for truly complex reporting needs
Pipedrive: The User-Friendly Option
Pipedrive offers insightful reporting tools in a user-friendly dashboard that prioritizes ease of use. You can sort deals by recency, person, activity, and win-loss filters to gain actionable insights.
The Statistics tab provides detailed reports on individual prospects and companies. Users reduced administrative hours by 40% by consolidating data into Pipedrive’s streamlined interface.
Best for: Small to mid-sized sales teams prioritizing simplicity and quick adoption.
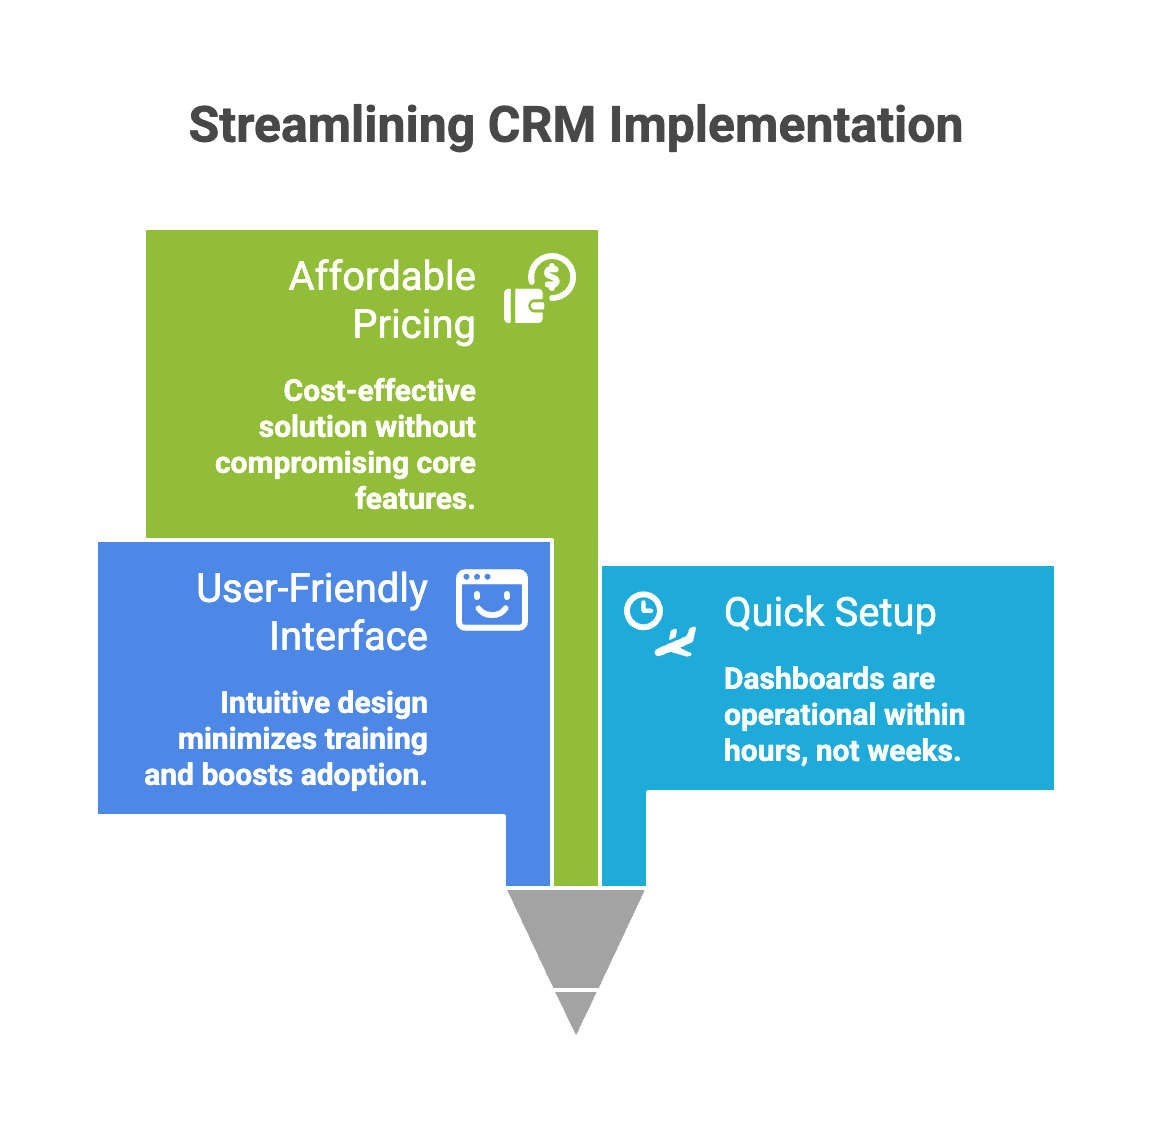
Advantages:
- User-friendly interface requiring minimal training and driving rapid adoption
- Quick setup, getting dashboards running in hours instead of weeks
- Affordable pricing, lower than enterprise platforms, without sacrificing core functionality
Limitations:
- Limited depth for advanced analytics and complex reporting
- Scaling challenges as organizations reach enterprise size
- Fewer customization options compared to larger platforms
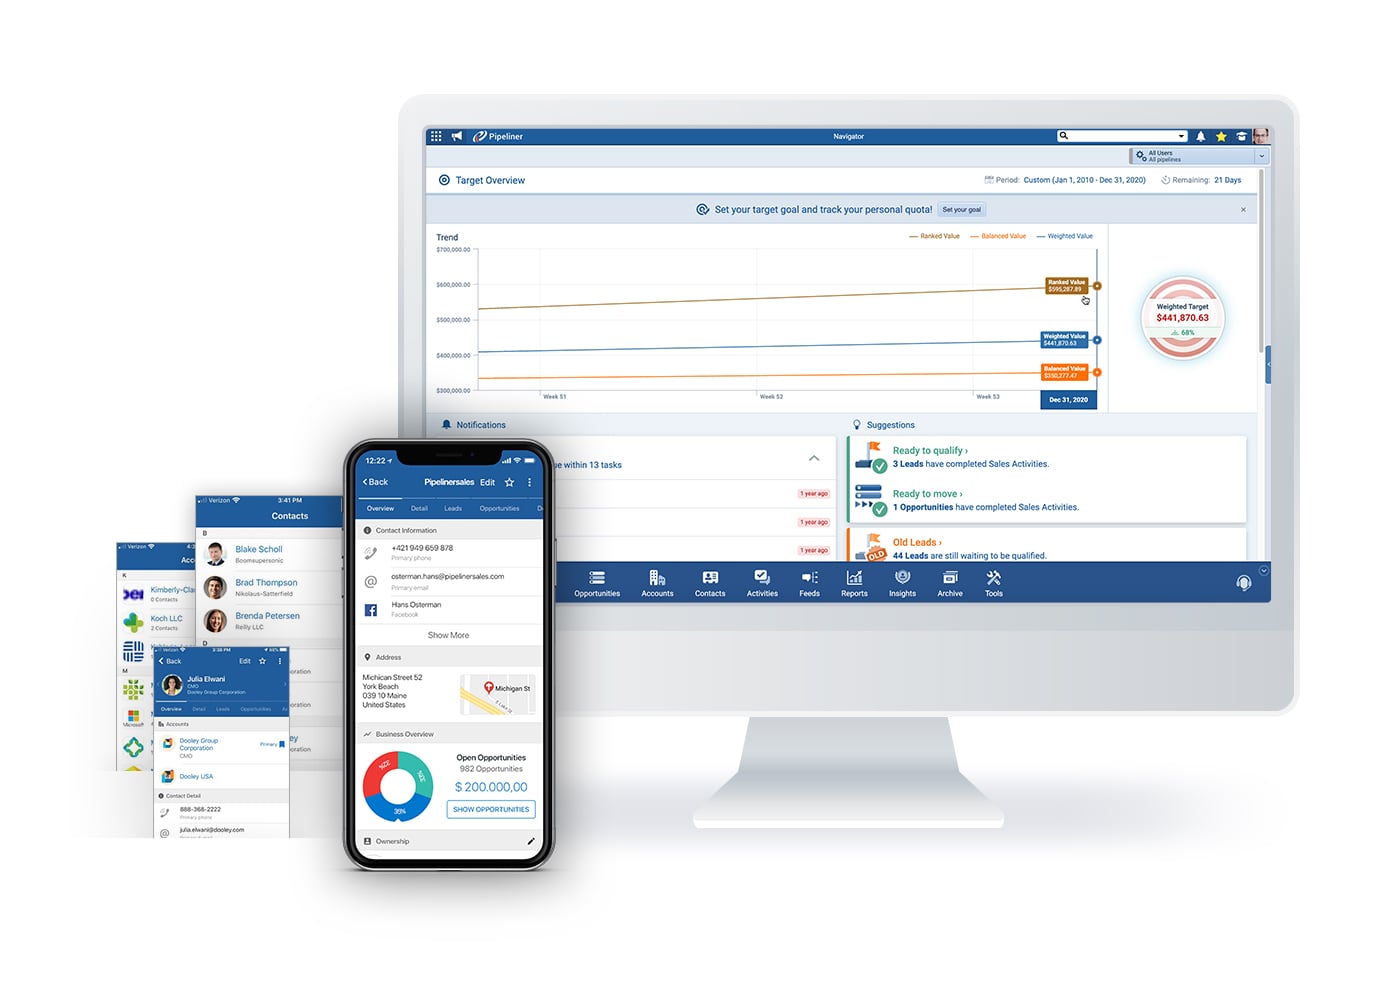
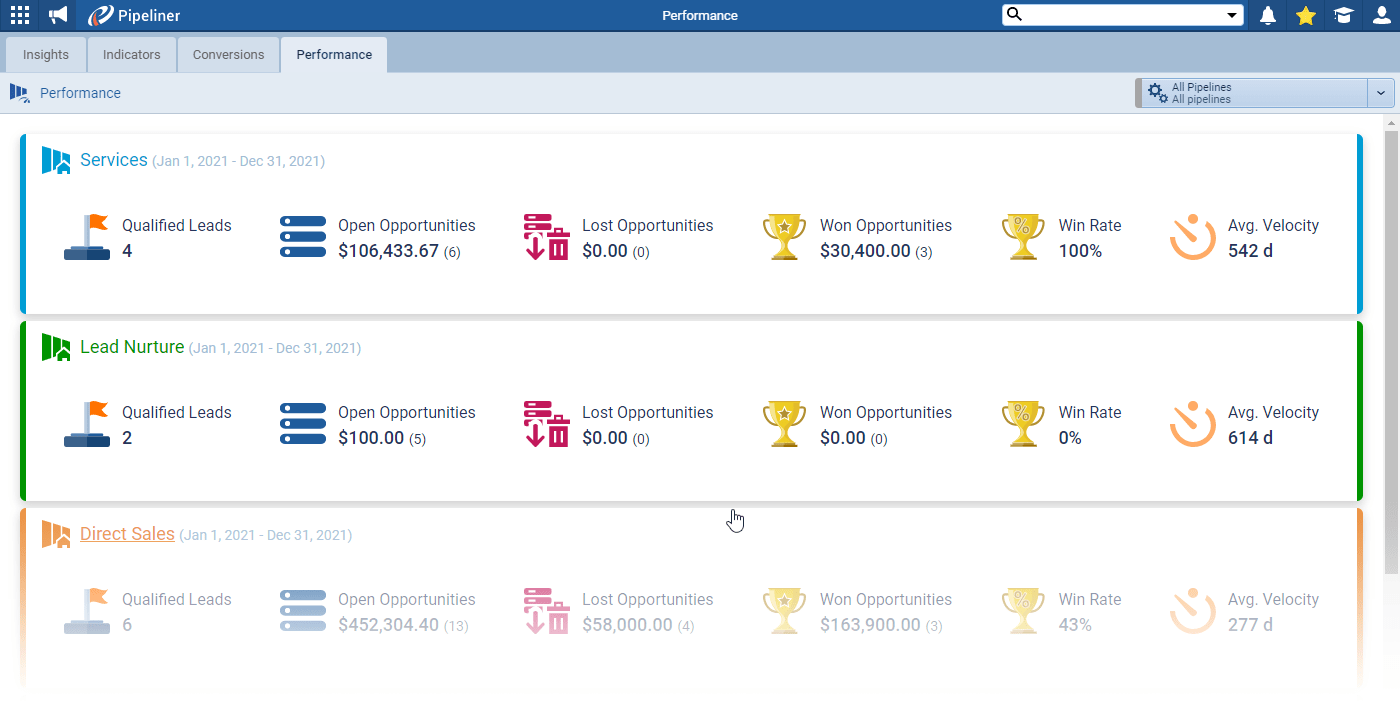
Pipeliner CRM: Visual Intelligence
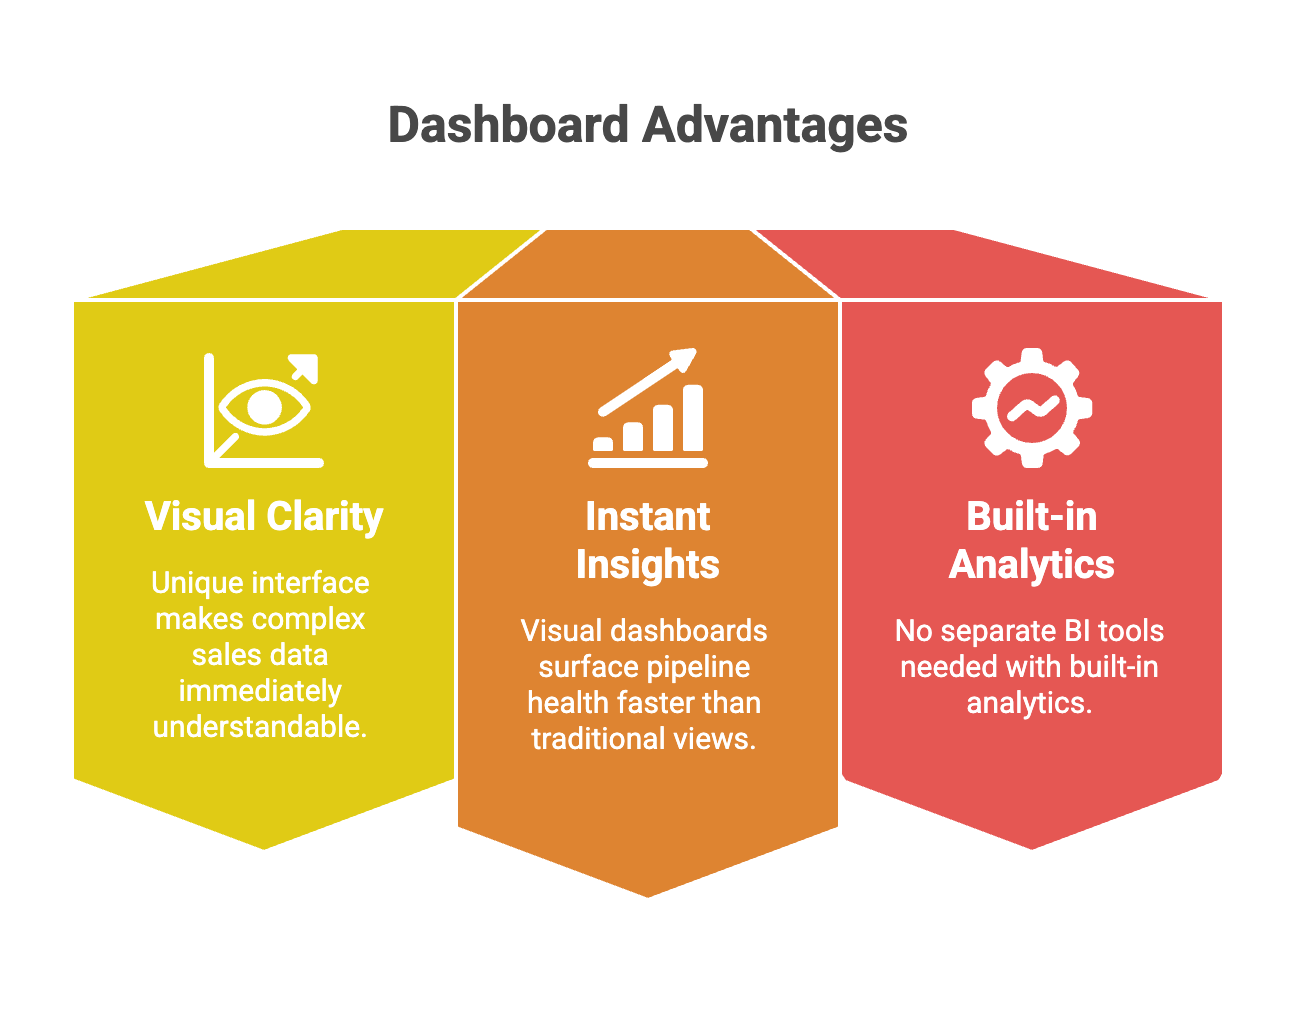
Pipeliner CRM delivers visual pipeline management with instant visual dashboards that surface deal status and sales health at a glance. The platform’s philosophy centers on making complex sales data immediately understandable through visual representations.
Built-in analytics provide forecasting, territory management, and performance tracking without requiring separate BI tools. The visual approach means reps spend less time interpreting data and more time acting on it.
Best for: Visual learners and teams wanting intuitive pipeline management without technical complexity.
Advantages:
- Visual clarity with a unique interface, making complex sales data immediately understandable
- Instant insights where visual dashboards surface pipeline health faster than traditional views
- No separate BI tools needed with built-in analytics
Limitations:
- Specialized approach where visual-first design works best for teams preferring graphical data
- Customization boundaries where the visual framework may limit extensive modifications
- Learning curve for teams accustomed to traditional list-based CRM interfaces
Zoho CRM: The Budget Option
Zoho provides customizable dashboards and reports to monitor the entire sales cycle. Users can incorporate CRM data from leads, contacts, campaigns, and tasks into unified views.
Predefined templates enable quick dashboard setup for standard use cases. However, advanced analytics requires the Ultimate edition or a separate add-on, which limits capabilities on lower tiers.
Best for: Budget-conscious teams needing standard dashboards without advanced analytics.
Advantages:
- Competitive pricing, lower than most alternatives, with solid core functionality
- Quick templates accelerate initial setup with predefined dashboards
- Comprehensive modules offering broad features beyond just sales analytics
Limitations:
- Limited analytics, where advanced reporting requires expensive upgrades
- Interface complexity is less intuitive than Pipedrive or HubSpot, despite a lower price
- Integration challenges connecting to non-Zoho tools without technical expertise
Microsoft Dynamics 365: The Microsoft Ecosystem Play
Dynamics 365 Sales is built on Dataverse and integrates natively with Outlook, Teams, and SharePoint. This makes it powerful for organizations already invested in the Microsoft ecosystem.
Copilot for Sales delivers record summaries and AI-generated email drafts. Pricing starts at $65 per user monthly for Professional, $105 for Enterprise, and $150 for Premium on annual plans.
Best for: Organizations heavily invested in Microsoft 365 wanting seamless integration.
Advantages:
- Microsoft integration with native connection to Outlook, Teams, and SharePoint
- AI capabilities, where Copilot features provide intelligent summaries and recommendations
- Enterprise features are robust enough for large, complex sales organizations
Limitations:
- Microsoft dependency, where it works best within the ecosystem
- Complex pricing with multiple SKUs and add-ons making total cost difficult to predict
- Steep learning curve, where powerful features require significant training investment
What Mid-Market B2B Teams Actually Need
The Mid-Market Sweet Spot
Mid-market organizations need systems sophisticated enough to support complex sales processes yet practical enough to be adopted rapidly without dedicated IT resources. This balance proves challenging as most platforms optimize for either simplicity or enterprise complexity.
Advanced reporting on sales performance, pipeline health, and customer behavior becomes critical at mid-market scale. With multiple territories, products, and sales stages, basic reporting no longer provides sufficient visibility for effective management.
The sweet spot combines enterprise-grade analytics with user-friendly interfaces that don’t require consultants to configure. Teams need dashboards that they can customize themselves as their processes evolve.
Must-Have B2B Features
Customizable dashboards configured for every team and role ensure relevant visibility across the organization. Sales reps, managers, and executives each need different views without cluttering everyone’s interface with irrelevant metrics.
Seamless integrations allowing data flow between platforms eliminate manual data entry and synchronization headaches. When your CRM connects to email, calendar, marketing automation, and customer success tools, the dashboards reflect the full customer interactions.
![]()
Advanced lead management, qualification, sorting, and prioritization help teams focus on the highest-value opportunities. Dashboards should surface which leads are most likely to convert based on engagement, fit, and historical patterns.
The Great CRM Migration
81% of sales leaders are considering CRM replacement in the next year, according to the State of Sales Tech 2025 report. This staggering number reflects widespread dissatisfaction with current platforms.
Finding CRMs with advanced AI, forecasting, and ease of use is challenging. Most platforms excel at one dimension while falling short on others. Enterprise systems offer powerful analytics but require extensive training. Simple systems are easy to use but lack depth.
The replacement trend creates an opportunity for platforms that balance sophistication with usability. Mid-market teams want enterprise capabilities without the complexity or cost of enterprise systems.
Built-In vs. Third-Party Analytics
Why Native Dashboards Win
Sellers spend most of their time in the CRM because it contains the information they need to close deals. Having dashboards on the same platform provides a holistic view with easy, in-depth dives without requiring extra time or effort.
Sales dashboards allow a focus on selling rather than administrative tasks. When analytics live in your CRM, you don’t waste time exporting data, building spreadsheets, or switching between tools.
Native dashboards eliminate the need for manual data export from CRM source systems, which is highly time-consuming and error-prone. Exported data has a limited scope and becomes static immediately, left in an unviewed spreadsheet while your pipeline continues evolving.
The Integration Advantage
Unified data systems sync information automatically across platforms, eliminating redundant manual work and ensuring customer information stays current everywhere it lives. When one system updates, all connected tools reflect those changes immediately.
Automatic duplicate detection saves time on manual cleanup. Information updates propagate automatically to all connected systems, freeing time for high-value work like actually selling.
Implementation Timeline Expectations
Initial Setup Phase
Basic template dashboards take hours to configure when using pre-built options. You select a template, adjust settings, and start using it the same day.
Complex custom implementations can take weeks to build from scratch with extensive customization. These projects involve defining KPIs, mapping data sources, designing layouts, and testing with users.
No-code platforms reduce setup time to minutes for standard dashboard types using drag-and-drop builders and preconfigured templates.
When Predictive Features Pay Off
Initial insights appear within 2-4 weeks of implementing predictive forecasting. Immediate benefits include better pipeline visibility and deal prioritization.
Forecast accuracy improves as the system learns from more data. Optimal forecast precision typically peaks after 3-6 months of consistent use.
❔ Common Questions Answered
What separates dashboards from traditional reports?
Dashboards present real-time data in a visual format to provide quick insights and support day-to-day decision-making. Reports are detailed and static, delving into historical data and trends, and are often exported for presentations or quarterly reviews. Think of dashboards as your live sales scoreboard, while reports are the post-game analysis.
How much time can teams save with unified dashboards?
Unified data systems eliminate redundant manual work by syncing customer information automatically across connected platforms. Pipedrive users reduced administrative hours by 40% by consolidating data into a single view. Automatic duplicate detection saves additional time on manual cleanup.
Do dashboards really improve forecast accuracy?
Predictive forecasting improves accuracy by 20-30% over traditional methods. Data-driven models achieve 75-95% accuracy when properly implemented. CRMs pull real-time deal data and historical trends to make more accurate revenue projections and automatically adjust expectations based on actual sales behavior.
Can anyone build dashboards without technical skills?
Drag-and-drop builders eliminate coding requirements completely. Sales teams customize dashboards independently without IT involvement. No-code platforms are accessible to users with any technical background, allowing them to adjust layouts, widgets, and data sources through visual interfaces.
How often should dashboard data update?
Critical metrics should refresh in real time or every 15-30 minutes to provide up-to-date visibility into pipeline status. Frequency depends on data volume and system capabilities. Activity metrics update more frequently than monthly summaries—daily call volume needs real-time updates, while year-to-date revenue can refresh hourly.
Which metrics are essential for sales dashboards?
Revenue versus targets, average deal size, and win rate form the foundation. Pipeline health indicators include deal velocity and conversion rates. Display no more than five to seven reports for comprehension—the human mind struggles to process more than seven ideas at a time.
How do role-based dashboards drive adoption?
Each role sees information most relevant to them, reducing time spent hunting for critical information. Role-specific views enhance productivity by consolidating critical data into a single location. This fosters a culture of data-driven decision-making across the organization.
Why choose built-in dashboards over separate analytics tools?
Sellers already spend most of their time in the CRM, so having dashboards on the same platform provides holistic views without extra effort. Native dashboards eliminate manual, time-consuming data export processes. Data remains current versus static exported spreadsheets that become outdated immediately.
![]()
The Bottom Line
CRM dashboards reduce administrative time by 40%, boost sales by 29%, and improve forecast accuracy by 20-30%, based on real-world implementation data across platforms like Pipedrive, monday CRM, and Nutshell. These aren’t small improvements—they represent fundamental changes in how sales teams operate.
Mid-market B2B organizations benefit most from role-based dashboards, no-code customization, and real-time pipeline visibility without requiring dedicated IT resources. The fact that 81% of sales leaders are considering replacing their CRM signals widespread recognition that current tools aren’t meeting modern needs.
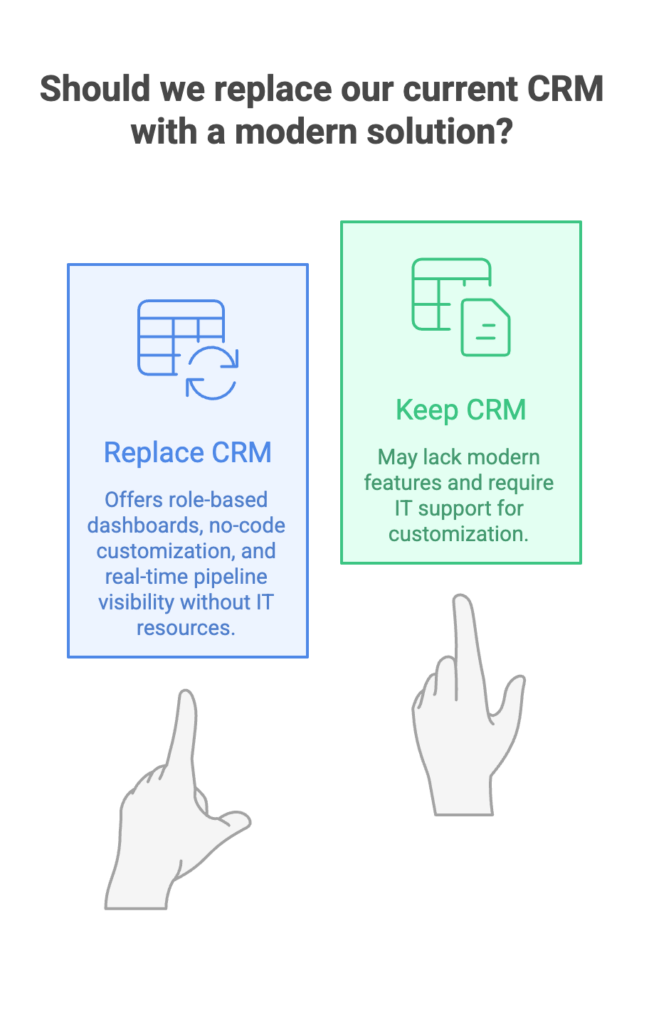
When choosing a platform, prioritize native analytics depth, ease of customization, and seamless integration over adding third-party reporting layers that create data synchronization challenges. Since sellers spend most of their time in CRM anyway, having analytics in the same platform eliminates the friction that kills adoption and buries insights in unused spreadsheets.


Comments