How to Fix Hockey Stick Sales Curve Chart Revenue Performance
Do you know what is the hockey stick sales curve chart?
Hockey stick sales curve chart is a fairly common descriptive term that describes:
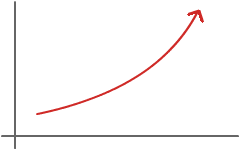
a revenue graph that creeps along the bottom or the middle of the graph for most of a period, usually a quarter, and then in the last few weeks jumps up to the top (resembling a hockey stick).
A Hockey Stick Sales Curve
It is the result of poor performance up until the last part of the quarter when every conceivable measure is taken to bring in those sales, and they are finally brought in.
While quotas may indeed be met, this type of performance is destructive to a company in many ways. The skillful implementation of a sales process, CRM solution and the right sales analytics will do away with hockey stick sales curve revenue performance—along with the severe stress brought to bear on sales reps and the rest of the company.
It Begins with Forecasts
A quarter always starts with sales forecasts. Traditionally these are done by sales management in consultation with sales reps, who are giving their best educated guesses about the various sales cycles they have in their pipelines. Those forecasts are then sent along to higher company executives who may, in an effort to bolster their own job security, “massage” those forecasts to make them look even better. Based on these forecasts, sales quotas are set.
Proper sales analytics were not utilized to create those forecasts and hence to set the quotas. It follows then that sales analytics are not utilized as the quarter progresses, and so salespeople and sales management are not actually informed as to how meeting of the quotas is actually progressing. When the period is nearly over, it suddenly dawns on everyone how far they actually are from hitting those targets, and all hell breaks loose in an over-the-ramparts effort rectify the issue.
Unusual Solutions
To bring those revenues up at the end of a quarter all manner of unusual solutions are often taken to close sales. Common measures are deep discounts and special terms, both of which lose the company money. Out of sheer desperation another solution can be resorted to which is harmful to the company, to the sales force and to the customer: making promises the company cannot keep.
Effects on Company
What happens when the majority of sales for an entire quarter are brought in in just a few weeks?
#1: Product Delivery
First, there is product delivery or implementation. The department or departments responsible for that delivery are stretched to the limits trying to service everyone at once, which not only results in severe worker stress but can also mean faulty delivery. Then there is customer service and support, who are put under the same strain and can also make mistakes or even leave some customers unserviced, despite their best efforts.
#2: Discounts
The special discounts and terms for a sudden influx of customers means a severe overload on accounting and collections, in addition to the direct loss of profit.
#3: Refunds
Lastly, if promises are made that the company cannot meet you have unhappy customers. That means potential refunds, more loss of revenue and—most damaging—loss of company and product repute.
Solving with Sales Process, CRM and Sales Analytics
Now let’s reexamine the situation with the implementation of a tried-and-true sales process, a CRM solution that exactly follows that sales process, and precise sales analytics. While this version of the story may be a little less exciting, it is certainly far less stressful on sales reps and other company employees and executives; and far more rewarding revenue-wise.
Forecasts could be generated by sales reps themselves, based on the leads they now have, value of sales cycles currently in the pipeline, close ratios, average sales cycle time, and other precise analytics. Those forecasts could then be forwarded to sales management, who then combines them into one report and sends them on up the line to upper management. Based on actual data, those forecasts are considerably more accurate.
As the quarter progresses, any dearth of leads can be rectified. Sales can be tracked in real-time through the various stages of the sales pipeline. Any time a sale or group of sales hangs up, immediate action can be taken—long before the end of the quarter is near.
As quarter-end is reached, no panic sets in, no unusual discounts, terms or promises must be resorted to—it simply happens that the quotas are met or exceeded. And life goes happily on.
Use proper sales analytics—in tandem with an established sales process and CRM solution—and eliminate hockey stick sales curve chart revenue performance forever.
See our other articles on sales analytics and sales force performance.
Todd brings over 20 years of sales and executive management experience to Coevera, most of it exclusively within the Customer Relationship Management (CRM) industry.
Todd brings over 20 years of sales and executive management experience to Coevera, most of it exclusively within the Customer Relationship Management (CRM) industry.
You need to log in to comment
Register with an email
address.
Already have an account? Log
in here.
Register
Log in
This website uses cookies. By continuing to use this website you are giving consent to cookies being used. For information on cookies and how you can disable them, visit our privacy and cookie policy.


 Unusual Solutions