


The use of KPIs (Key Performance Indicators) to measure a sales team’s growth or contraction have been used for many years. Some examples include gross sales, net revenue, products sold, and others that demonstrate how a company has succeeded (or not) through a particular period (quarter or year).
But these particular KPIs are actually lagging indicators – so called because they only reflect what has been done. It is rather like the final score of a football game that’s already been played—by the time lagging indicators are recorded, it is too late to change anything. Hence, KPIs are needed which help predict what those lagging indicators will be. These are called leading indicators, and they are used much too infrequently in sales.
Lagging Indicators
Lagging indicators are performance metrics of events that have already occurred, such as:
- Sales
- # of units sold
- Gross margin
- # of different products sold
- Market share
- Gross revenue
- # of deals won
- # of deals lost
Of course, these are necessary measures because they provide you a clear analysis of “what has happened so far.” With lagging indicators, you can analyze many different kinds of information, such as conversion rate, time to close, lead value, and opportunity velocity.
Lagging indicators also provide you a view of the weak points in your sales organization so you can mark them, and address them. Such weak points would exist in people, the sales process, and in the overall company.
Lagging indicators could be used to compare salespeople. Let’s say one salesperson is taking 40 days to close an average deal size of $20k. Another is taking 50 days to close average deal sizes of $15k. Yet another is taking 50 days to close an average deal size of $22k. This picture gives you a good idea of specific areas for coaching and mentoring.
Understanding
Such analysis can only be had by the data. You can only analyze the data and utilize it if you understand it. That is where technology comes in, as technology is used not only to gather data but as a powerful assistant to analyzing it.
If you don’t have such analytics, you’re truly lost as an organization. It would be like Elon Musk’s SpaceX rocket being launched for the International Space Station with no analysis of what occurs in each stage of flight.
Lagging Issues
But there is a real problem with analysis conducted through lagging indicators only. A clue to the problem is right there in the name: lagging. It means, “what has already happened.” By the time lagging indicators become clear, it is too late to change anything.
Going back to the football analogy we brought in above: what if a football coach only coached based on scored touchdowns, and no other indicators? This is an excellent if exaggerated example. The coach would have no way at all to steer his team toward victory.
Of course, lagging indicators are needed, as demonstrated above. But in managing for the future, we need something that will show us how the activities we are engaging in now will impact our figures for the quarter or the year.
Leading Indicators
Which leads us to the other kind of KPIs: leading indicators. Leading indicators could be said to be the KPIs that come between the big lagging-indicator victories.
Leads
The first leading indicator would be that of leads since any sales process begins with leads. Without leads (and an adequate number of them) there are no sales. No sales, no revenue, no revenue, no company. So it’s quite obvious that leads are of prime value.
Inbound vs. Outbound
There are 2 main categories of leads: inbound, and outbound.
Inbound leads are those that come from prospects reaching into you (hence the name). They are generally caused by marketing campaigns, public relations efforts (articles, videos or others), web searches, word of mouth, or others. These leads can be strong, with an identified need and reach. Or they can be of a weaker variety—your product or service is being checked out along with many others for a possible purchase some distance into the future.
Outbound leads are those that result from your personnel reaching out from your company. These can come about through cold calling, personal contact, or the like. Like inbound leads they can be weak or strong: for example, one might come from a close friend or relative of the sales rep, a relationship of trust which has a high likelihood of resulting in a close. Or, it could be someone who just wanted to get the sales rep off the phone.
Some sales organizations today are shying away from outbound leads—but for any sales organization to truly succeed, they really should round out their lead efforts with a combination of inbound and outbound.
Your first set of metrics would be raw measures of leads, per sales period:
- # of leads
- # of inbound leads
- # of outbound leads
Lead Scoring
The next set of metrics comes about in lead scoring.
A company with active lead generation activities occurring (both in marketing and in sales) will be generating quite a number of raw leads. But each of these will have different value to sales: some will be bona fide deals closeable in the near future. Others aren’t even real leads, but simply trade show inquiries given in exchange for your cool t-shirt. Then there is everything in-between, including prospects actually looking to purchase, but at some point further in the future.
The best way for these leads to be rapidly separated out is through lead scoring. When leads are scored and the score is evident right in CRM, sales reps (or inside reps) can choose leads to pursue that will actually be viable.
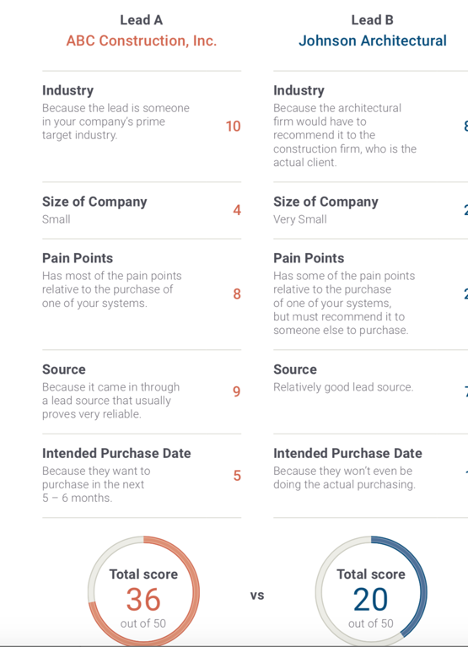
Leads can be scored based on any number of criteria. For example:
- Industry
- Size of company
- Pain points (based on issues your product or service would solve)
- Source (for example, paid lead versus word of mouth, which would be far more valuable)
- Intended purchase date (with a higher score for a purchase date closer to the present)
A score can be assigned for each of these criteria, adding up to a total.
For example, let us say your company sells air conditioning to builders of commercial buildings. If each of the rating criteria were rated 1 – 10, you might have 2 leads rated as shown below:
Number of Leads Needed
You’ll need to know how many leads it takes to keep your sales machine viably up and running, as well as succeeding and making its targets.
Before you can figure out the number of leads you require, you’ll need to figure out your sales process.
Once you have a working sales process in place, you’ll need to figure out the duration of your sales process.
Next, you’ll need to know the overall conversion rate of leads to opportunities. Here is a good formula for figuring that out:
Total # of raw leads
———————————- = LEAD CONVERSION RATE
Actually Qualified Leads
Then, you’ll need to know the size of your average opportunity. A good formula for figuring that out is:
SUM of all new revenue in a given period
————————————————————— = AVERAGE OPPORTUNITY SIZE
# of new customers or deals during same period
Let us take an example of how this all works out.
Let us say the duration of your sales process is 3 months, and your conversion rate is 3 out of 10 (an average of 3 leads out of 10 convert to opportunities and continue moving up through the sales process).
If your average opportunity size is $10,000, and your target for the quarter is $1,000,000, you will need at least 10 converted leads to make that target.
Since 3 out of 10 leads normally convert to opportunities, that means you will need at least 30 raw leads, at the beginning of the quarter, to support that overall target.
You also have the issue of the number of leads your sales team can handle. Two formulas for figuring that out is:
Rep Lead Capacity
Maximum # of leads that can be worked per day X 20 Working Days/month
= MONTHLY LEAD CAPACITY PER REP
Sales Team Capacity
Monthly lead capacity per rep X The number of reps
= MONTHLY SALES TEAM CAPACITY
Using these formulas, you will then know when you need to add more reps in order to handle the influx of leads.
Opportunities
Once leads convert to opportunities, then it is a matter of figuring out how many winning deals it takes to profitably sustain the company’s pipeline, and monitoring that.
In the Leads section, we have already figured out the average length of time for an opportunity through the pipeline.
We have also figured out the average opportunity size.
Along with these, you’ll now need to know your Win Rate for opportunities—basically the opportunity-to-close conversation rate, the number of deals that actually turn to wins. Here is a great formula for that:
Won Deals or Opportunities
—————————– = LEAD CONVERSION RATE
Actually Qualified Leads
If you take a given quarter for the company and find that you had 11 won deals for that period, and 42 qualified leads, you would then divide 11 by 42, which would give you .26. When you multiply .26 by 100 you get 26—so you can see that your win rate is 26%.
Working with these, you’ll then know how many opportunities must be in the pipeline for any given period, in order to make a quota for that period.
Once again let us go back to our example of a company providing air conditioning for commercial buildings, and utilize the metrics given above.
The average time from lead to close is 3 months. The average opportunity size, as we’ve already stated, is $10,000. The average closing rate (ratio of opportunities to actual closed sales) is 26%.
Let us say the quota for a quarter is $1,000,000. You would need to begin any quarter (3-month period) with a minimum of 126 deals in the pipeline, in order for 10 of them, at an average of $10,000, to close by the end of the quarter.
Importance of Leading Indicators
You can see, by monitoring each one of your leading indicators, how your lagging indicators are going to turn out if no changes are made.
Too many analysis systems leave out leading indicators, or don’t concentrate on them enough. This is also true of sales technology such as CRM systems, too many of which completely leave out leading indicators.
Back in our football analogy, the leading indicators in a football game could be yards gained and first downs achieved, as these measure forward motion of the ball toward a touchdown. Yards lost or ball possession lost means the other team is winning—and strategy sure needs to change.
The same is true in sales. A lessened number of new leads means the sales pipeline up the way is going to suffer, as would a lower percentage of opportunities through each sales stage.
In our next article, we’ll take up the skillful combination of leading and lagging indicators. Stay tuned!


Comments